Debugging memory bloat

Rails memory issues are frequently more difficult - and more urgent - to resolve than performance problems: a slow Rails app may be painful, but if your app chews through all available memory on a host, the app is down.
This chapter shows how to identify memory-hungry controller-actions and specific memory-hungry requests, provides a visual representation of common pitfalls, and suggestions on fixing memory bloat.
Memory bloat vs. memory leak
Memory bloat is a sharp increase in memory usage due to the allocation of many objects. It’s a more time-sensitive problem than a memory leak, which is a slow, continued increase in memory usage and can be mitigated via scheduled restarts.
Visually, here’s the difference between bloat and a leak:
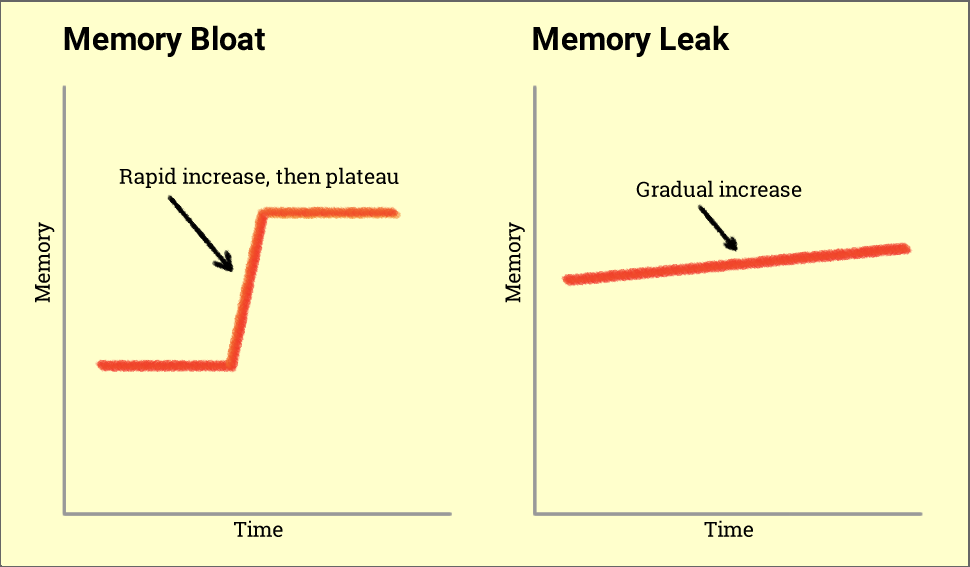
While memory bloat can quickly cripple a site, it’s actually easier to track down the root cause than a memory leak. If your app is suffering from high memory usage, it’s best to investigate memory bloat first given it’s an easier problem to solve than a leak.
What goes up doesn’t come down
If one of your app’s power users happens to trigger a slow SQL query, the impact is momentary. Performance will likely return to normal: it’s rare for a slow query to trigger long-term poor performance.
If, however, that user happens to perform an action that triggers memory bloat, the increased memory usage will be present for the life of the Ruby process. While Ruby does release memory, it happens very slowly.
It’s best to think of your app’s memory usage as a high-water mark: memory usage has no where to go but up.
This behavior changes how you should debug a memory problem versus a performance issue.
Which endpoint impacts memory usage more?
The chart below shows requests from two endpoints, Endpoint A and Endpoint B. Each circle represents a single request.
Which endpoint has a greater impact on memory usage?
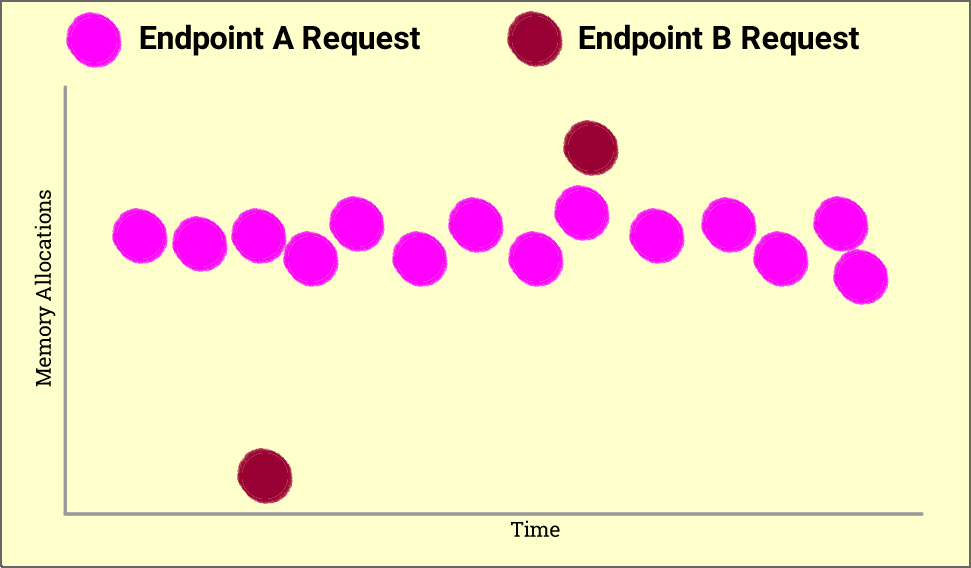
Analysis:
- Endpoint A has greater throughput
- Endpoint A averages more allocations per-request
- Endpoint A allocates far more objects, in total, over the time period
If the y-axis was “response time” and you were optimizing CPU or database resources, you’d very likely start optimizing Endpoint A first. However, since we’re optimizing memory, look for the Endpoint with the single request that triggers the most allocations. In this case, Endpoint B has the greatest impact on memory usage.
What you need to know about memory bloat
In order of importance:
- Memory Usage is a high-water mark: Your Rails app will likely recover quickly when it serves a slow request: a single slow request doesn’t have a long-lasting impact. This is not the case for memory-hungry requests: just one allocation-heavy request will have a long-lasting impact on your Rail’s app’s memory usage.
- Memory bloat is frequently caused by power users: controller-actions that work fine for most users will frequently buckle under the weight of power users. A single request that renders the results of 1,000 ActiveRecord objects vs. 10 will trigger many allocations and have a long-term impact on your app’s memory usage.
- Focus on the maximum number of allocations per controller-action: a normally lightweight action that triggers a large number of allocations on a single request will have a significant impact on memory usage. Note how this is very different than optimizing CPU or database resources across an app.
- Allocations and memory increases aren’t correlated on a long-running app. Once your app’s memory heap size has grown to accommodate a significant number of objects, a request that requires a large number of allocations won’t necessarily trigger a memory increase. If the same request happened early in the Rails process’ lifetime, it likely would trigger a memory increase.
- You will see a number of memory increases when a Rails application is started: Ruby loads libraries dynamically, so some libraries won’t be loaded until requests are processed. It’s important to filter out these requests from your analysis.
Using Scout to fix memory bloat
Scout can help you identify memory-hungry areas of your Rails app by:
- Isolating the controller-actions generating the greatest percentage of allocations.
- Viewing transactions traces of specific memory-hungry requests to isolate hotspots to specific areas of code.
- Identifying users triggering memory bloat
Isolating allocation-heavy actions
If you’re looking for a general understanding of which controller-actions are responsible for the greatest amount of memory bloat in your Rails app, a good starting point is the “Endpoints” section of Scout:
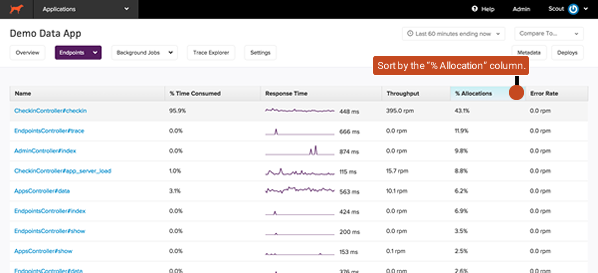
Sort by the “% Allocations” column. This column represents the maximum number of allocations recorded for any single request for the given controller-action and timeframe. Why max and not mean allocations? See this section above.
Click on an endpoint to dive into the Endpoint Detail view. From here, you can click the “Allocations - Max” chart panel to view allocations over time.
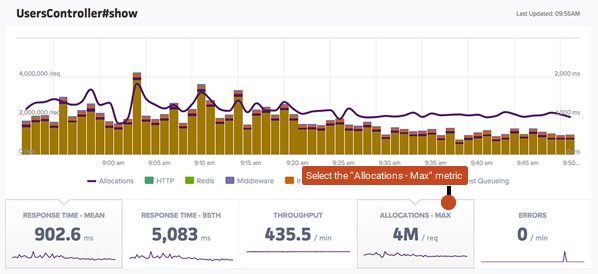
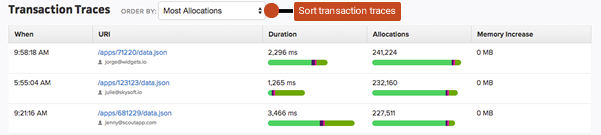
Beneath the overview chart, you’ll see traces Scout captured over the current time period. Click the “Most Allocations” sort field from the pulldown. You’ll see traces ordered from most to least allocations:
Reading a Scout memory trace
The screenshots below are generated from actual Scout transaction traces. A quick primer on the trace organization:
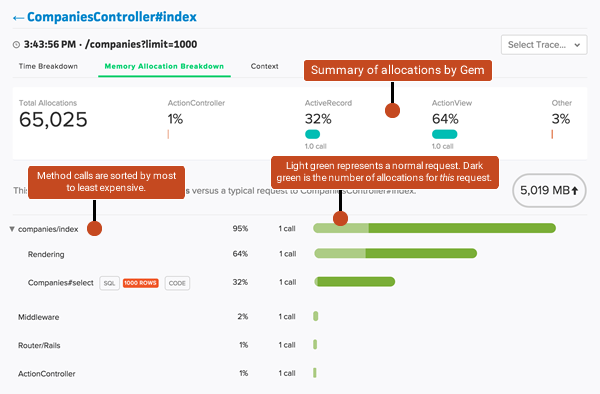
Method calls displayed in the trace details are organized from most to least allocations. The horizontal bar on the right visually represents the number of allocations associated with the method call(s) on the left. Some of the bars may have two shades of green: the lighter green represents the control case (what we view as a normal request) and the darker green represents the memory-hungry case.
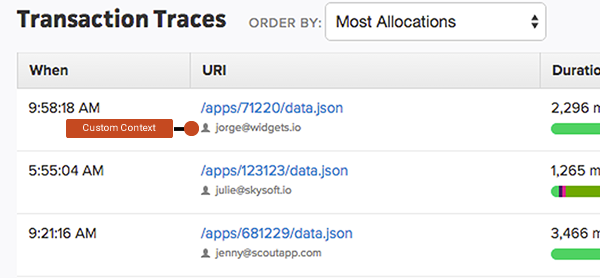
Identifying users triggering memory bloat
It’s common for memory bloat to be isolated to a specific set of users. Use Scout’s context api to associate your app’s current_user with each transaction trace if it’s not easily identify from a trace url.
Common Pitfalls
Memory bloat often reveals itself in specific patterns - these patterns are illustrated via the Scout transaction trace below.
ActiveRecord: rendering a large number of objects
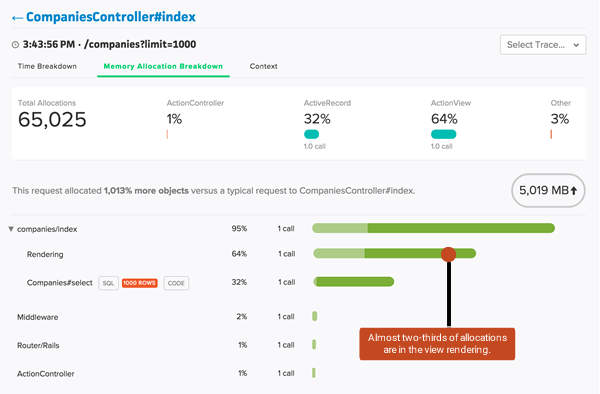
When rendering the results of an ActiveRecord query that returns a large number of objects, the majority of allocations frequently come from the view and not from instantiating the ActiveRecord objects. Many Strings are allocated to represent each object’s attributes as well as any HTML template code around them (table rows and other HTML elements).
The screenshot below illustrates the difference between rendering a view with 1,000 records and one with ten. Two-thirds of allocations reside in the view:
An example where this occurs:
def employees
  @company = Company.find(params[:id])
  @company.employees
end
Fetching and rendering all employees for a company may work fine for the latest small startup, but it fall over for Apple, Inc.
The fix? Pagination via will_paginate or Kaminari.
ActiveRecord: N+1 Database Queries
You probably already know N+1 queries are low-hanging fruit when it comes to speeding up your controller-actions. However, in addition to frequently being slower than a proper includes, they result in more allocations.
The example below illustrates an N+1 when rendering out a list of 100 users and their associated company. Roughly 2x more allocations result from the N+1:
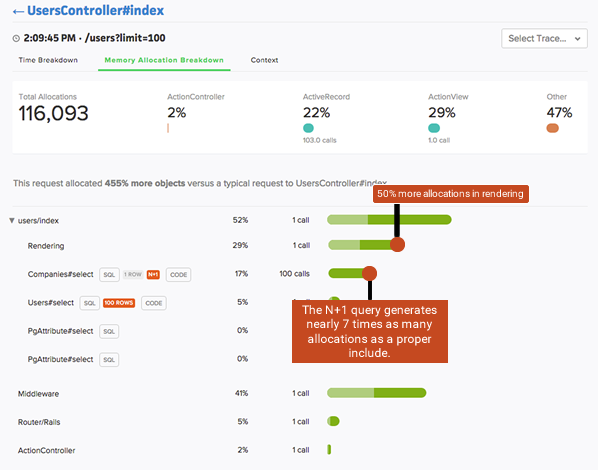
The steps to fixing N+1 queries are well-documented: the larger challenge is finding the worst offenders. Scout can be used to identify the worst-offending N+1 queries in your app.
ActiveRecord: selecting unused large columns
The standard ActiveRecord finder selects all columns from the respective table:
User.all # User Load (756.6ms) SELECT "users".* FROM "users"If a table contains a large column (binary or text), there’s a cost both in terms of memory usage and time if that column is returned. This is true even if the column is never accessed.
Identifying this scenario is more involved: if a large column isn’t accessed, it will not trigger additional Ruby allocations and will not appear in a memory trace. Instead, look at the change in memory for that request:
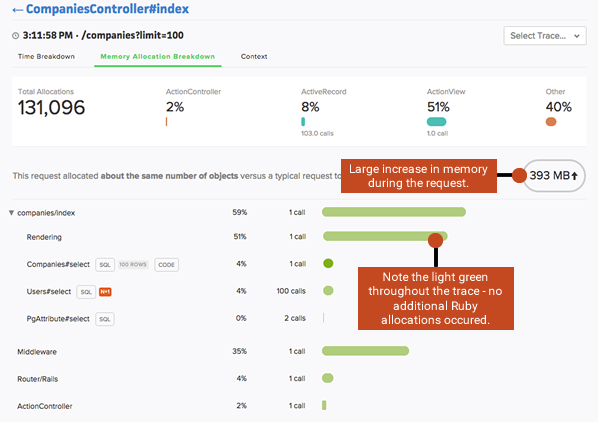
It’s also likely the query may run slower as more data is read from the database and sent across the wire to your app host: look for a slow query in the “Time Breakdown” section of the trace.
The fix
A couple possible approaches:
- Only select what you need:
User.select(:name). - Move the large column to a dedicated table so the default finder is fast by default.
Uploading a large file
Your app will incur a significant memory increase to handle large file uploads. For example, the trace below illustrates the increase in memory usage when uploading a 1 GB file vs. a 1K file:
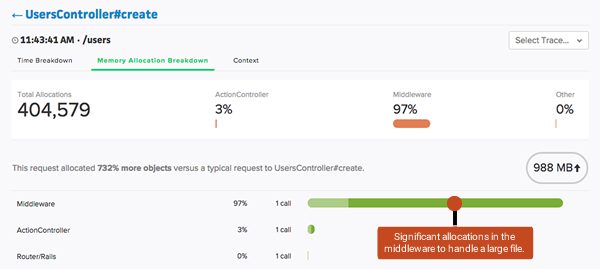
The majority of allocations occur unwrapping the file in the framework middleware. A common scenario where this behavior occurs: an app manipulates uploaded images that are typically 100-500 kB in size, but then a user attempts to upload a 10 MB image.
The workaround: send large files directly to a third party like S3. See Heroku’s docs on Direct to S3 Image Uploads in Rails.
Suggested Reading
- That’s Not a Memory Leak, It’s Bloat - This digs into more specifics on common ActiveRecord patterns that contribute to bloat. While the post is from 2009, and as expected, some of the tools are outdated, the Ruby theories still apply.
- The Complete Guide to Rails Performance - This book (purchase required) has a chapter dedicated to memory bloat and leaks that digs deeper into the internals of Ruby memory usage.
- How Ruby Uses Memory - This article takes a deeper into the internals of Ruby memory usage.
Subscribe for more
We're publishing chapters as we complete them. Enter your email address below to be notified of updates to the Rails Performance Fieldbook.